
Choosing Industry Analytics Platforms for ML-Forward Success

Why industry analytics platforms matter for ML-forward organizations
Imagine your company has many different kinds of information. Some data might be about money, like how much you spend or earn. Other data might be about how your operations are running, like how many products you make or how quickly. Often, these pieces of information are kept in separate places, like different digital folders or systems. This makes it really hard to get a full, clear picture of what is happening across your whole business. When data is spread out, it is tough to make smart choices quickly, especially for companies that use machine learning (ML) to help them grow.

This problem of scattered data is a big deal for organizations that want to use ML well. They need to bring all their financial and operational data together. This is where industry analytics platforms come in. These special tools help gather, sort, and understand all your company’s data in one place. They make it easier to see important trends and make better decisions. The market for these platforms is growing fast, expected to reach USD 44.57 billion in 2026 alone, showing how important they are for businesses today Industrial Analytics Market – Size, Share & Growth, Trends.
Platforms like Clearwater Analytics are designed to give companies a single, clear view of their data.
They help turn raw numbers into useful insights. This kind of business intelligence software is vital for companies that rely on machine learning to find new ways to improve. For these "ML-forward" organizations, having strong Why Enterprise Data Systems Are The Backbone Of AI Success is not just helpful, it is necessary.
In this article, we will give you a clear plan to look at different analytics platforms. We won’t just focus on one brand or type. Instead, we’ll help you think about important things like what features they offer, how easy they are to set up, how secure your data will be, and how much they truly cost over time. This way, you can pick the best platform to help your company use its data and machine learning efforts to their fullest.
Want to stay informed on the latest advancements in AI and technology? The AI Newsletter Worth Reading delivers clear daily updates right to your inbox.
Market landscape: who uses industry analytics platforms and why
Now that we know how important it is to bring all company data together, let’s look at who uses these smart tools. Many different types of businesses and departments rely on industry analytics platforms to make better choices. They all want to use their data and machine learning in the best way possible.
Here are some of the main groups that use these platforms:
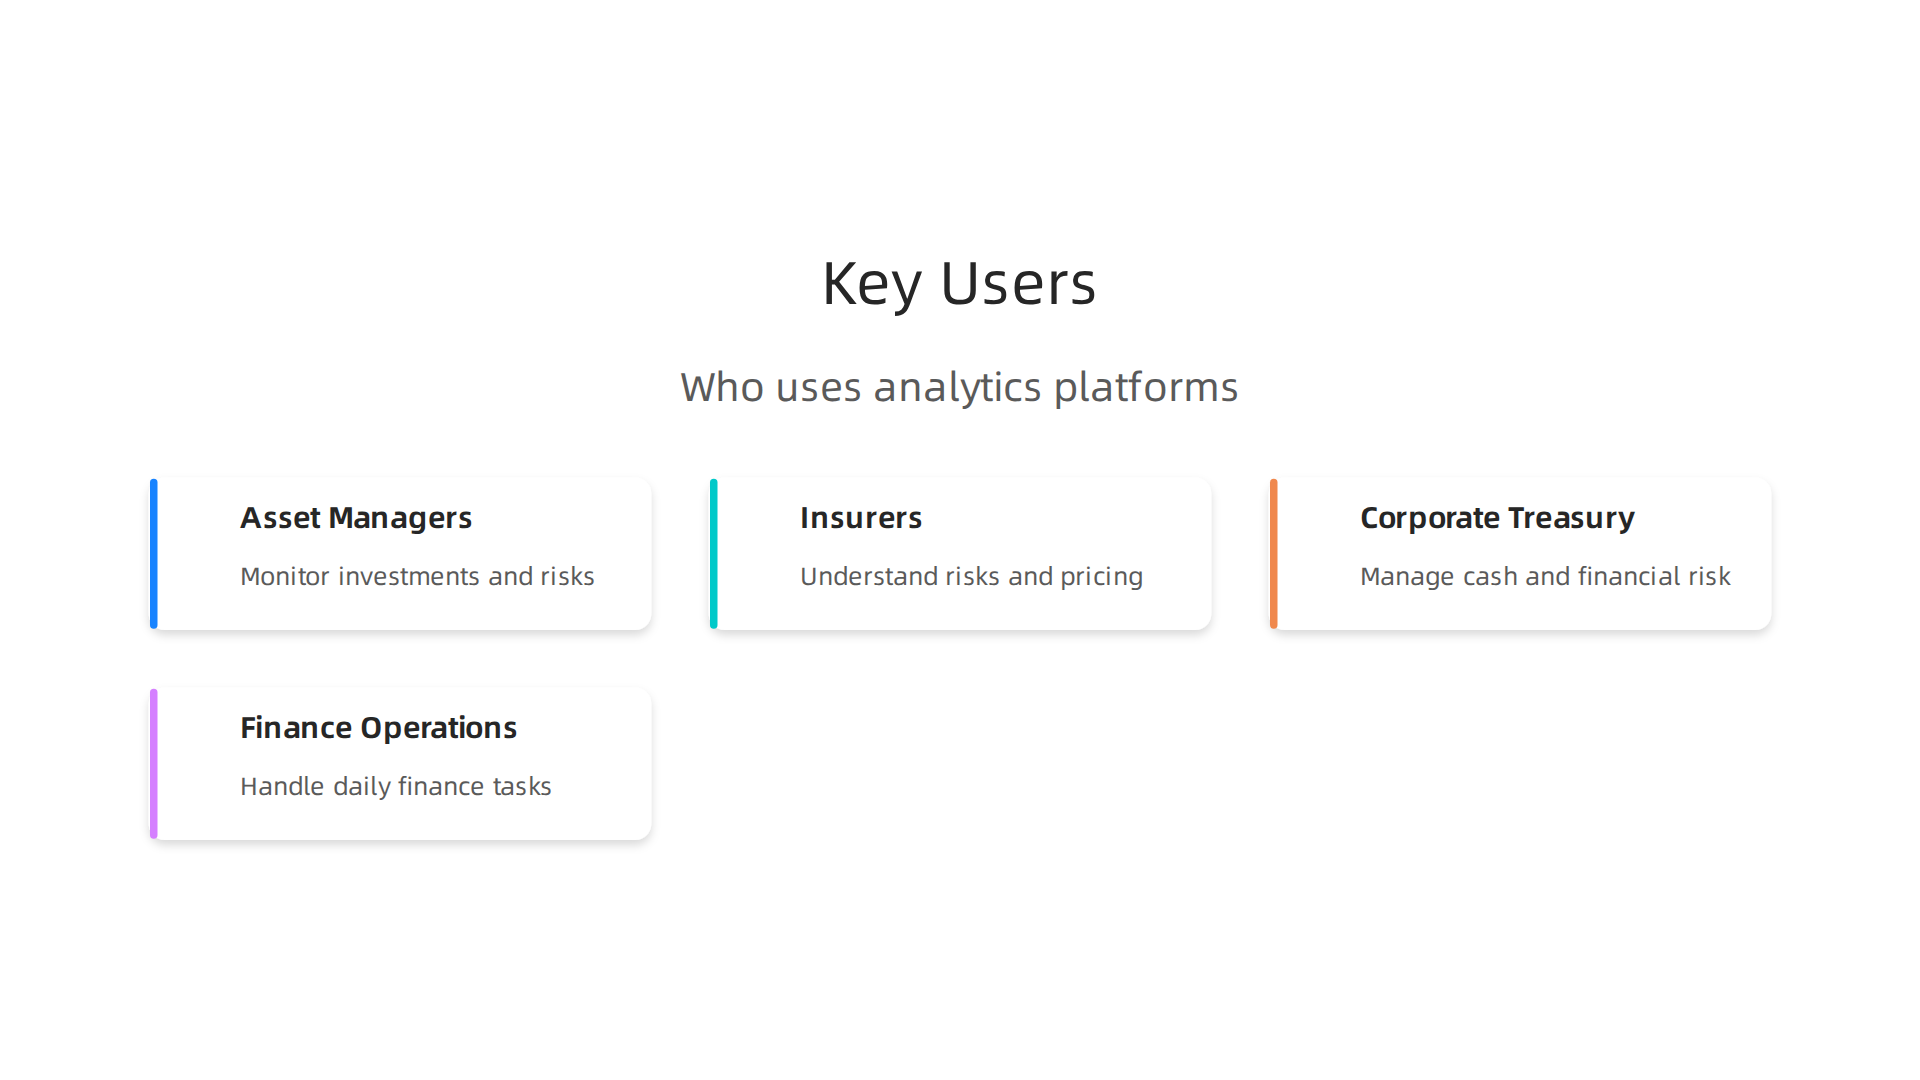
- Asset Managers: These companies manage large sums of money for others. They use these platforms to keep a close eye on investments, understand risks, and make quick decisions about buying or selling.
- Insurers: Insurance companies use analytics to understand risks better, set fair prices for policies, and handle claims more smoothly. This helps them stay strong and dependable.
- Corporate Treasury: This part of a company manages its money, like cash flow and debt. They use these tools to make sure the company has enough money to run and to protect it from financial risks.
- Finance Operations: This group handles all the daily money tasks. Industry analytics platforms help them see what’s happening with money in real-time, making sure everything is correct and efficient.
Beyond these finance-focused groups, many other industries are quickly adopting these tools. For example, the need for these platforms is growing fast in manufacturing, car making, and energy sectors. This is because they help with things like predicting when machines might break down and making production lines run better Industrial Analytics Market Size & Share [2034]. In fact, the banking, financial services, and insurance (BFSI) segment is expected to lead the market, making up 28% of it in 2026, mainly for managing risks and understanding customers better Business Intelligence & Analytics Market Forecast, 2026- ….
Why companies choose these platforms
Companies decide to get industry analytics platforms for a few main reasons. First, they need to make smarter choices faster than ever before. With so much data, it’s hard to keep up without help. These platforms allow companies to bring all their information into one place, giving them a single, clear view of everything. This helps them use machine learning to find hidden trends and new ways to grow.
Another big reason is to manage risks better and follow all the rules. For finance companies, keeping up with changing rules is a huge job, and these platforms make it easier. They also help companies make their operations more efficient and adapt to new digital ways of working. By 2026, many new analytics tools will even suggest insights using AI automatically, changing how companies get value from their data Data Analytics Market Research Report 2034 – Dataintelo. If you want to dive deeper into using smart tools, check out our guide on how to use AI in 2026.
Setting up the platform and market trends
Getting these platforms to work with a company’s existing systems can be tricky. It’s like teaching old computers to talk to brand-new ones. Companies often need special help to set up and connect everything. However, more and more companies are moving their data tools to the cloud, which can make things easier over time. Experts predict that by 2026, more than 65% of companies will have moved their analytics work to the cloud, which helps more people access these powerful tools Global Business Analytics Market Set to Reach USD 176.14.
We are also seeing a trend where bigger companies are buying up smaller ones that make these analytics tools. This means there are fewer, but larger, companies offering a wide range of services. This consolidation can lead to more complete solutions for buyers but might also mean fewer choices in the long run. Companies like Clearwater Analytics and others are always looking for ways to offer the best and most complete service. When choosing, it’s good to consider all your data analysis tools in 2026.
Choosing an industry analytics platform is a big decision. After thinking about who uses these tools and what big trends are happening, it’s key to look closely at what the platforms can actually do. You want to make sure the platform has the right parts to handle your company’s unique data needs.
Key capabilities to evaluate in industry analytics platforms
When you’re looking for an analytics platform, it’s like picking a powerful new tool for your workshop. You need to know what features it has under the hood. Here are some core parts that good platforms, like advanced business intelligence software, should offer:
- Data Ingestion & Normalization: This is how the platform brings in all your different data, no matter where it comes from. Then, it cleans up and organizes that data so it all looks the same. This step is super important because messy data leads to wrong answers. Modern platforms must have deep data integration abilities Key Features for Analytics Platforms: 2026 Guide. Tools like Integrate.io are known for handling real-time data pipelines smoothly, taking in data from many places and getting it ready fast Top 8 Data Analytics Tools for 2026.
If you want to learn more about how companies handle getting all their data together for smart systems, you might find our article on Electronic Data Gathering and Retrieval for Machine Learning Pipelines in 2026 helpful.
- Time-Series Handling: Many important company numbers change over time, like sales each month or stock prices each day. A good platform can understand and work with this kind of data, spotting trends and patterns that happen over weeks, months, or years.
- Analytics Engine: This is the brain of the platform. It’s the part that does all the number crunching and finds insights. In 2026, the best engines often use AI to automatically suggest what the data means, making it easier for everyone to get value from it Top 10 Self-Service Analytics Tools in 2026: Complete Guide.
Some, like Oracle Analytics Cloud, even let you bind AI filters to your reports Explore the Oracle Analytics May 2026 Update.
- Reporting & Dashboards: After all the work, you need to see the results clearly. These features let you create easy-to-understand charts, graphs, and reports. A good dashboard gives you a quick look at how things are going, often in real-time, helping you make quick decisions.
- APIs (Application Programming Interfaces): Think of APIs as special connectors that let your analytics platform talk to other software your company uses. This means you can share data and insights smoothly with different tools and systems, making the platform even more useful.
What technical buyers look for
When people who really understand technology buy these platforms, they look for more than just the basic features. They want to know how strong and reliable the platform is.
- Scalability: This means the platform can grow with your business. If your company gets bigger and has much more data, the platform should be able to handle it without slowing down or breaking.
- Latency: This refers to how fast the platform can give you answers. In today’s fast world, you often need insights right away, not hours later. A low latency platform gives you real-time information, which is key for quick reactions.
- Data Lineage: This is like a history book for your data. It shows where every piece of data came from, how it was changed, and where it went. This helps make sure your data is trustworthy and correct, which is super important for staying honest and following rules.
- Model Integration Capabilities: Many companies use special AI models to predict things or find deeper patterns. A top-notch analytics platform can easily work with these models, letting you use their power directly within your analysis. This ability to integrate with AI and machine learning is a core part of what makes modern platforms strong How enterprise analytics platforms are evolving.
Companies like Clearwater Analytics are always aiming to offer these kinds of advanced features. Understanding these core capabilities and technical needs will help any business pick the best platform for its future.
Now that you know what important features to look for and what tech experts value in these systems, the next big step is to match these platform abilities with what your company truly needs. This is where a smart plan for mapping your requirements comes in handy. It helps you see if a platform, like Clearwater Analytics, is a good fit for your business.
How to map Clearwater Analytics into your requirements (functional breakdown)
Choosing the right industry analytics platform is not just about picking the one with the most bells and whistles. It’s about finding the one that solves your specific business problems. A data analytics platform is a system that brings together different parts of how you handle data, from storing it to making sense of it Data Analytics Platforms Compared (2026). To do this well, you need a clear way to compare what a platform offers against what your company needs. Think of it as a checklist, but much smarter.
Here is a simple way to map out your needs to a platform’s features:
- Business Need: What exactly does your company want to achieve or improve?
- Platform Feature: Which part of the analytics platform helps meet that need?
- Key Performance Indicator (KPI): How will you measure if the platform is actually helping you reach your goal? These are the numbers that show success.
Let’s look at how a finance team might use this template to evaluate a platform like Clearwater Analytics.
They need strong business intelligence software to manage complex financial data. Before you start, it’s crucial to define your main goals and pick the right KPIs that match those goals Best Practices for Implementing Analytics in your Business.
| Business Need | Platform Feature (Example: Clearwater Analytics) | Key Performance Indicator (KPI) |
|---|---|---|
| Financial Reconciliation | Automated data matching and validation | Reduce time spent on monthly close by 15% |
| Clear data lineage | Decrease errors in financial reports by 5% | |
| Portfolio Accounting | Real-time valuation and performance tracking | Improve accuracy of portfolio values by 10% |
| Customizable investment dashboards | Speed up performance report generation by 20% | |
| Regulatory Reporting | Secure, standardized report templates | Ensure 100% compliance with financial rules |
| AI-driven insight summaries | Reduce manual report preparation time by 25% |
By using a table like this, you can clearly see if a platform’s capabilities truly match your needs. For instance, if your company heavily relies on social media insights, you’d map "understanding customer sentiment from social media" as a business need and look for "twitter analytics integration" as a platform feature. If you have specific data science needs, platforms like Tiger Analytics might offer features that align better with complex model development. The goal is to choose a tool that truly helps your business grow. You need to make sure the data collected is used to answer the right business questions 10 best practices for analytics success.
Understanding how enterprise data systems support your overall strategy is vital for getting the most out of any analytics investment. If you want to dive deeper into why these systems are so important, read our article on Why enterprise data systems are the backbone of AI success.
Thinking about how to pick the right data analysis tools for your team? You can explore more options and guidelines in our guide to data analysis tools 2026.
Now that you have a good plan for matching what you need with what a platform offers, the next step is to actually put that plan into action. This means carefully rolling out and connecting your chosen analytics platform, like Clearwater Analytics, with your company’s systems. A good deployment is key to making sure your investment really pays off.

Implementation & integration: practical steps for deployment
Getting a new analytics platform up and running isn’t something you do all at once. It’s more like a journey with several clear steps. Think of it as a phased rollout to make sure everything works smoothly. This way, you can fix small problems before they become big ones.
Here are the practical steps to deploy your new analytics system:
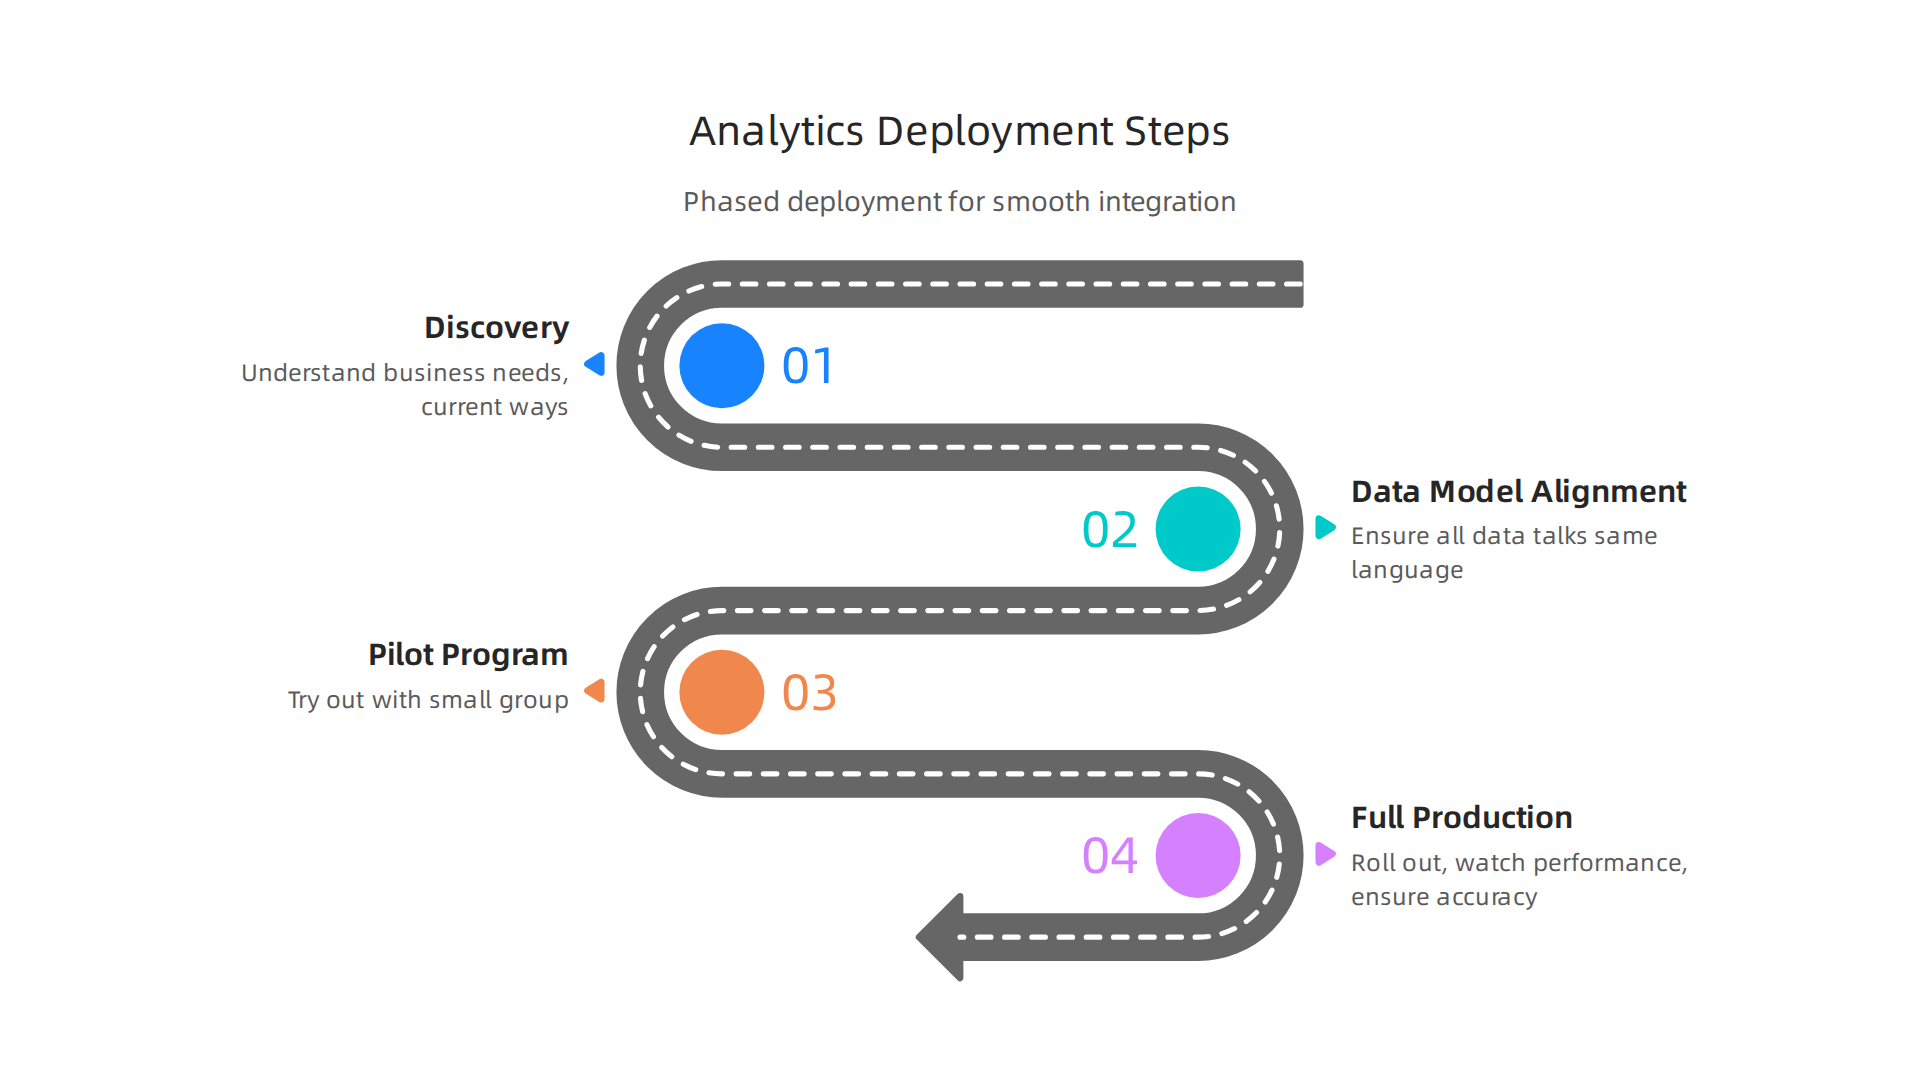
- Discovery: First, you need to deeply understand what your business does and what problems you want the new platform to solve. This means looking at your current ways of working and writing down what you need the system to do. This planning stage is crucial for a successful setup Analytics implementation: A 12-step guide (Tracking plan …). A good plan also checks how your business earns money and handles payments 5 Steps For Successful Analytics Platform Implementation – YuktaMedia.
- Data Model Alignment: This is about making sure all your data talks the same language. You’ll need to set up rules for how your data is stored and organized so that the new platform, like Clearwater Analytics, can understand it. Using common data types and a plan for how data moves (called ETL or ELT pipelines) helps a lot here How to Build a Data Analytics Platform: Best Practices – Seedium. You can watch a helpful video about building a modern analytics platform to understand more about data flow Building a Modern Analytics Platform.
- Pilot Program: Before you give the new platform to everyone, try it out with a small group or for one specific task. This "pilot" helps you see if it truly works as expected and if people find it easy to use. You can gather feedback and make changes before a bigger launch How to Build a Modern Data Platform – instinctools. This small start helps check if your team has the right skills and gets engaged with the new tools Best practices for implementing data analytics services in ….
- Full Production & Monitoring: Once the pilot goes well, you can roll out the platform to the whole company. But the work doesn’t stop there! You need to keep watching how it performs, making sure the data is accurate, and that everyone is following the rules for using it. Regular checks ensure the system keeps working for you Best Practices (Microsoft Azure).
How Analytics Platforms Connect with Other Tools
Analytics platforms like Clearwater Analytics don’t usually work alone. They often need to connect with other systems in your company. These connections are called "integration patterns":
- APIs (Application Programming Interfaces): These are like digital messengers that let different software programs talk to each other. Clearwater Analytics can use APIs to get data from your other systems or send its insights to them.
- ETL Pipelines (Extract, Transform, Load): This is a common way to move data. It means taking data from one place (Extract), changing it so it fits the new system (Transform), and then putting it into the analytics platform (Load). This ensures data quality and consistency.
- Event-Driven Ingestion: This is for data that comes in constantly, like real-time updates. The platform can be set up to quickly grab new pieces of data as soon as they appear, which is great for things like real-time business intelligence software or quickly analyzing social media data.
- Working with MLOps and Data Platforms: Many companies already use tools for machine learning operations (MLOps) or other data platforms. Your new analytics platform should be able to work alongside these existing tools. For example, it might share data with systems that use Python for data science or integrate with tools like Azure Machine Learning to build and use AI models Implementing Data Analytics Platform with Azure – The Tech Society.
Understanding these steps and ways to connect will help you get the most out of your analytics investment, whether you’re using Clearwater Analytics, looking into features for tiger analytics, or setting up twitter analytics.
For those keen on sharpening their data skills, exploring techniques that make data easier to understand is a valuable step. Check out our article on exploratory data analysis techniques for machine learning in 2026.
After getting your analytics platform, like Clearwater Analytics, set up and connected, there’s another very important step: making sure it keeps your data safe and follows all the rules.

In 2026, privacy and security are not just nice to have; they are a must-have for any business.
Security, privacy, and compliance considerations for analytics platforms
When you use powerful tools like business intelligence software to understand your company’s data, you also take on the job of protecting that data. This means thinking about security, privacy, and following specific laws and rules, often called compliance. This is true whether you are using a big platform like Clearwater Analytics or something more specific like twitter analytics for social media insights.
Important rules for keeping data safe
For financial companies and large businesses, there are many rules about how data must be handled. Here are some key controls your analytics platform needs to have:
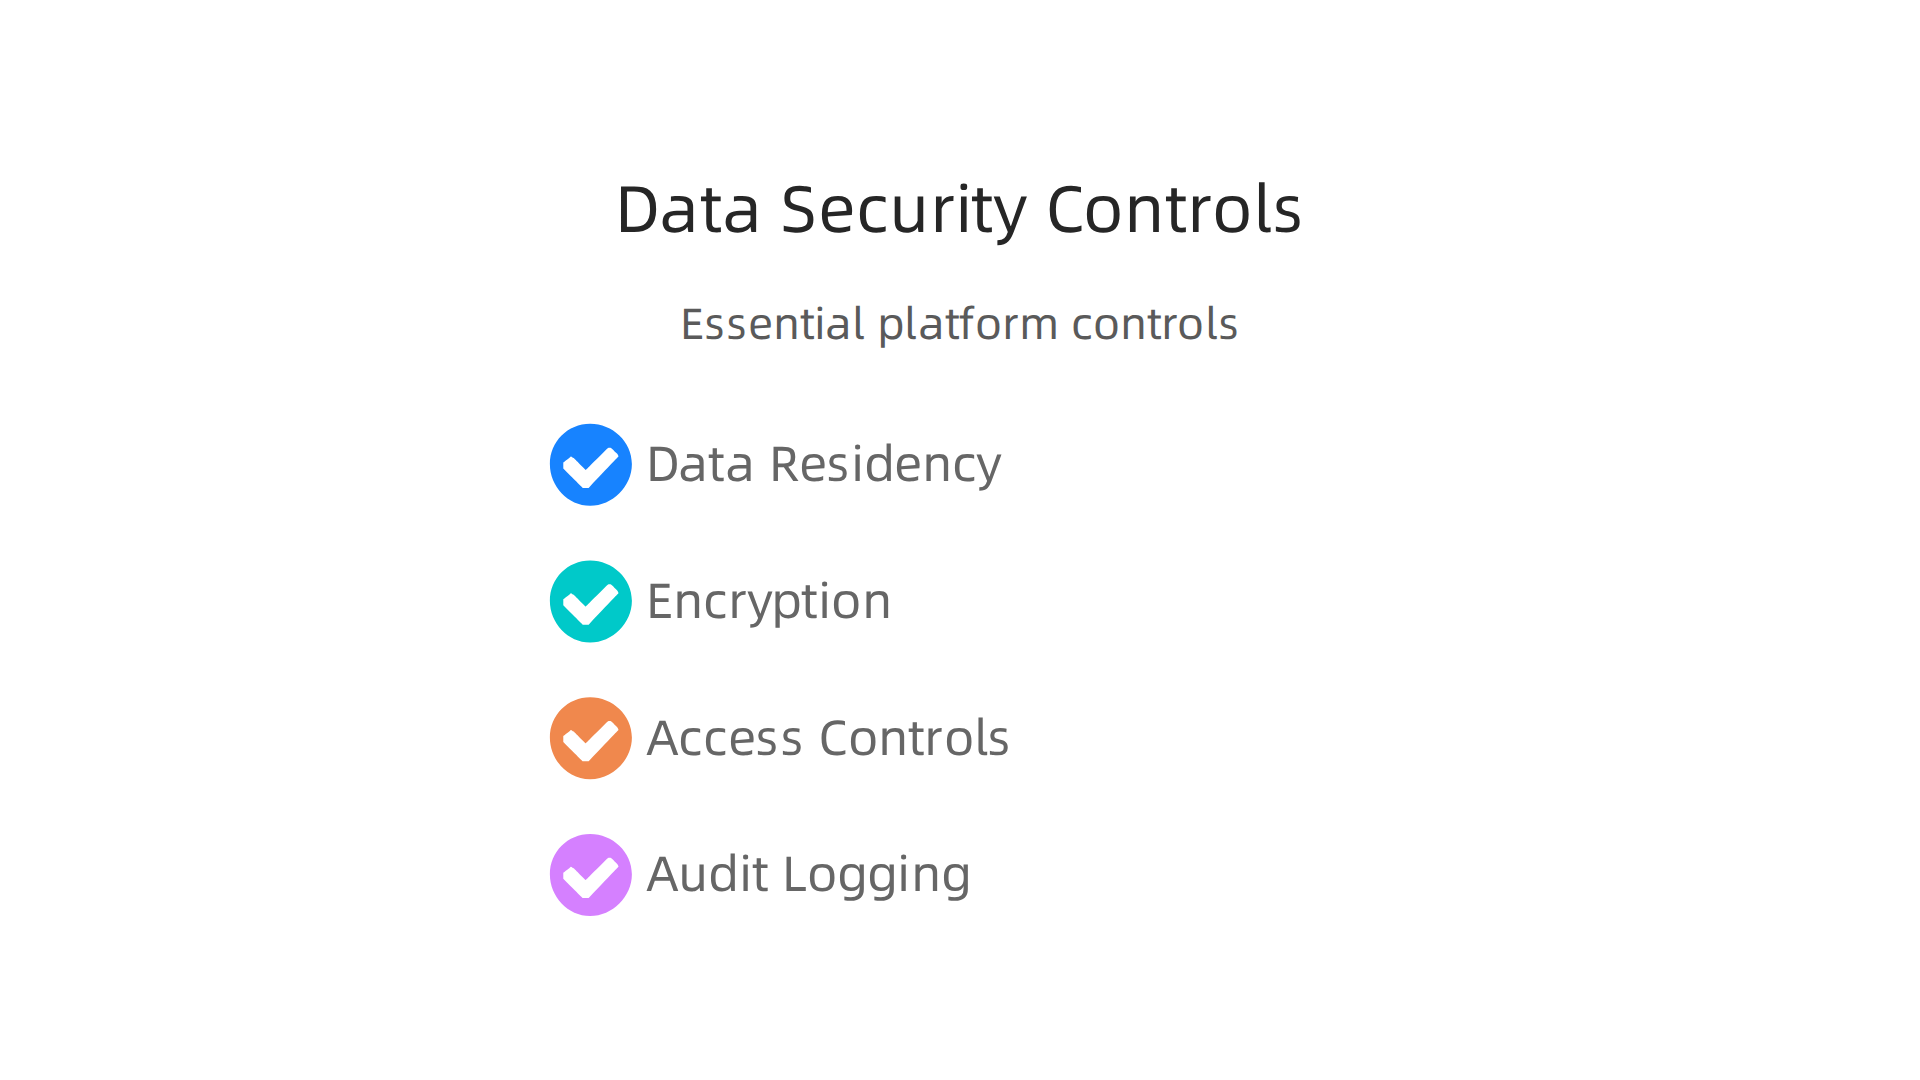
- Data Residency: This means where your data is actually stored. Some laws say that certain types of data must stay within a country or region. Your analytics platform needs to prove it can meet these needs, especially for things like SOC 2 compliance, which often asks about data residency SOC 2 Data Residency: A 2026 Compliance Guide with ….
- Encryption: This is like putting your data in a secret code so only approved people can read it. Data should be encrypted both when it’s sitting still (at rest) and when it’s moving from one place to another (in transit).
- Access Controls: Not everyone should be able to see all data. Access controls make sure only the right people have permission to view or change certain information. This is very important for privacy laws like GDPR Meeting GDPR, HIPAA & SOC 2 with On-Prem Analytics.
- Audit Logging: This means keeping a detailed record of who did what, and when, inside the analytics system. If something goes wrong, audit logs help you trace back what happened.
What regulations should you know about?
Many types of businesses have their own rules. Here are some common ones that affect analytics platforms:
- GDPR (General Data Protection Regulation): This is a European law about protecting personal data. If your company deals with customers in Europe, your analytics setup needs to follow GDPR rules for how it collects, stores, and processes their information 9 Best GDPR-Compliant Analytics Tools (2026 Comparison). This includes making sure your data processing agreements are in order with all vendors that handle personal data.
- HIPAA (Health Insurance Portability and Accountability Act): For healthcare companies in the US, HIPAA protects sensitive patient health information. Any analytics platform handling this data must be HIPAA compliant.
- SOX (Sarbanes-Oxley Act): This law affects public companies and requires them to have strong financial reporting controls. Your analytics system must support these needs, especially for financial data.
- SOC 2 (Service Organization Control 2): This is a report that shows how a service provider manages customer data based on five "trust services criteria" like security and privacy. Many companies will want their analytics providers to have a SOC 2 report Data Security Compliance: Standards, Regulations & Best ….
Learning about these security and privacy topics is crucial for any professional working with data. If you want to dive deeper into how data systems support big operations, you might find our article on why enterprise data systems are the backbone of AI success helpful.
A checklist for checking platform security
Before choosing an analytics platform or even a specific service like tiger analytics, use this checklist to make sure it’s secure and compliant:
- Certifications: Does the platform have security certifications like ISO 27001 or FedRAMP (for government work)? These show they meet high security standards.
- Third-Party Audits: Has an outside company checked their security? A SOC 2 report is a good example of this kind of audit.
- Compliance Alignment: Does the platform specifically say it can help you meet requirements for GDPR, HIPAA, or SOX if those apply to your business?
- Data Breach Plan: What happens if there’s a data leak? A good platform and vendor will have a clear plan for what they will do to fix it and tell you about it.
- Data Processing Agreements (DPAs): For GDPR, you need signed agreements with every service that touches personal data. Make sure your analytics provider can offer this.
Picking an analytics platform isn’t just about features; it’s also about trust. By carefully checking these security and compliance points, you can make sure your data is safe and your company stays out of trouble. This helps protect not just your business, but also the privacy of your customers. If you are exploring different options, understanding data analysis tools 2026 can guide your selection process.
After making sure an analytics platform is safe and follows all the rules, the next big step is to look at how much it will really cost and what kind of return you’ll get from that investment. This means looking at the full picture, not just the sticker price.
Vendor evaluation, ROI and total cost of ownership (TCO) framework
When picking a powerful tool like business intelligence software, it’s smart to have a plan. You want to know if it’s worth the money and how to choose the best one.

This is where figuring out the Return on Investment (ROI) and Total Cost of Ownership (TCO) comes in. It helps you compare different options, whether you’re looking at Clearwater Analytics, Tiger Analytics, or even a tool for twitter analytics.
Understanding Total Cost of Ownership (TCO)
TCO is like adding up all the costs related to a purchase over its whole life, not just what you pay upfront. It helps you see the long-term expense of owning something. As one source explains, TCO covers the purchase price plus all the costs of keeping it running TCO vs. ROI: Differences and Which One To Use and When.
Here’s a simple way to think about TCO for an analytics platform:
- Upfront Costs:
- Licensing and Subscription Fees: This is the main price you pay to use the software.
- Hardware: If you need new computers or servers.
- Setup and Consulting: Money paid to experts to help you get started.
- Ongoing Costs:
- Implementation and Integration: Getting the new system to work with your old ones. This can include moving your old data to the new platform.
- Training: Teaching your team how to use the new analytics platform.
- Maintenance and Support: What you pay to keep the system updated and to get help when things go wrong.
- Upgrades: Costs for new features or versions of the software.
- Hidden Fees: Sometimes there are extra charges for things like storing more data or having more users.
- Opportunity Costs: This is what you might lose out on by choosing one solution over another. For example, if a cheaper tool takes twice as long to give you insights, you’re losing time that could have been used to make more money.
A common way to calculate TCO is to sum up upfront costs, operating costs over the years of use, and then subtract any value left at the end, if any TCO vs ROI: What is the Difference?. Considering all these points gives you a much clearer picture of the real cost, which is important when thinking about technology ROI The Real Way to Calculate Technology ROI.
Understanding Return on Investment (ROI)
ROI tells you how much money you get back compared to what you spent. It measures the benefits or gains from your investment. For an analytics platform, these benefits might not always be money directly. They could also be things like:
- Better Decisions: Getting smarter insights from your data helps you make better choices for your business.
- Saving Time: Automating tasks that used to take a lot of human effort.
- Finding New Chances: Spotting market trends or customer needs you didn’t see before.
- Cutting Risks: Using data to avoid mistakes or problems.
The basic formula for ROI is to subtract the total cost from the total expected benefits, then divide that by the total cost, and multiply by 100 to get a percentage TCO and ROI: When to Use Each Calculation (2026). It’s helpful to look at ROI over the same time period as your TCO.
Comparing vendors with a smart plan
When you’re ready to pick an analytics platform, use a clear process:
- Define Your Needs: What do you really need the platform to do? List out the must-have features, like deep data integration or real-time processing, as modern platforms offer many capabilities Key Features for Analytics Platforms: 2026 Guide.
- Request for Proposal (RFP): Send a detailed document to different vendors. Ask them to explain how their platform meets your needs and to provide a breakdown of all costs (licensing, setup, support, etc.). This helps you compare apples to apples.
- TCO and ROI Analysis: For each vendor, use the TCO and ROI frameworks above. Calculate what you expect to spend and what you expect to gain over three to five years.
- Proof of Concept (POC): Ask your top choices to show you a small project using your actual data. This helps you see how the platform works in real life.
- Check References: Talk to other companies that use the platform. Ask them about their experience with the vendor and the software.
By following these steps, you can pick an analytics platform that not only has great features but also makes good financial sense for your company. Understanding how to compare all the options and their costs can be a big task. If you’re looking for more details on evaluating different kinds of AI and data tools, check out our guide on choosing all AI tools types evaluation and workflow for 2026.
Want to stay in the loop on all things AI? Get clear daily AI updates from The AI Newsletter Worth Reading.
After understanding how to pick an analytics platform today, it’s also smart to look at what’s coming next. The world of data and business intelligence software is always changing, and 2026 is no different. We are seeing big shifts in what these tools can do and how companies sell them.
Future trends: where industry analytics platforms are headed in 2026 and beyond
The industrial analytics market is growing very fast. Experts say it was worth about $44.57 billion in 2026 and is expected to grow even more in the coming years, driven by the need for smarter ways to manage businesses and make quick decisions Industrial Analytics Market – Size, Share & Growth, Trends. This growth is pushing analytics platforms to become much more powerful.
Here are some key trends shaping the future:
- Real-Time Analytics: Getting answers right away is becoming super important. Imagine knowing what’s happening with your customers or machines at the exact moment it occurs. This helps businesses react faster and fix problems before they get big. Many platforms, including those used for things like twitter analytics, are now focusing on giving you insights as they happen, not hours later.
- Embedded Machine Learning (ML) and AI: Analytics platforms aren’t just showing you what happened anymore. They are now using AI and ML to tell you why things happened and even what will happen next. They can suggest what you should do. By 2026, over 80% of new analytics tools will have AI built-in to give you smart advice by default Data Analytics Market Research Report 2034 – Dataintelo. This means tools from companies like Clearwater Analytics or Tiger Analytics will offer more than just reports; they’ll offer solutions.
- Explainable and Auditable Pipelines: As AI becomes more common, it’s vital to understand how it makes its suggestions. People want to know why the AI recommends something, especially in important areas like finance or healthcare. Future platforms will make it easier to see how the data flows and how AI reaches its conclusions, making it more trustworthy.
- Platform Composability: This big word just means that platforms are being built in smaller pieces that can work together. Instead of one giant, rigid system, you can mix and match different tools to create a custom analytics solution that fits your exact needs. This gives businesses more freedom and flexibility.
How vendors are changing
Because these new trends are so important, companies that make analytics software are changing how they do business.
- Partnerships: Vendors are teaming up with other companies to offer complete solutions. For example, a company specializing in data storage might partner with an AI company to give you both.
- Vertical Specialization: Some vendors are focusing on specific industries, like manufacturing or banking, to offer highly specialized analytics that solve unique problems in those areas.
- Modular APIs: They are offering their features as small, buildable parts (called APIs) that other programs or systems can easily connect to. This supports the idea of composability and allows businesses to build their own unique analytics workflows without being stuck with one vendor’s entire suite of tools.
These changes mean that when you look for an analytics platform in 2026, you’ll find more choices and more flexible ways to get the insights you need. It’s an exciting time for anyone who works with data. To learn more about how AI is changing the landscape, consider our guide on AI overview 2026 what machine learning practitioners need to know.
Summary
This article explains why industry analytics platforms are essential for ML-forward organizations and how to choose, deploy, and justify them. It covers the market drivers and typical users (asset managers, insurers, treasury, finance ops), the core capabilities to evaluate (data ingestion, time-series, analytics engine, dashboards, APIs), and the technical criteria that matter to buyers such as scalability, latency, data lineage, and model integration. The piece gives a practical template for mapping platform features to business needs using Clearwater Analytics as an example, then walks through a phased implementation plan, integration patterns (APIs, ETL, event-driven ingestion), and a security/compliance checklist. It also explains how to compute total cost of ownership (TCO) and return on investment (ROI), run vendor comparisons and proofs of concept, and highlights future trends like embedded AI, explainability, and composable platforms. After reading, you will be able to evaluate vendors against concrete requirements, plan a safer rollout, and build a business case for an analytics platform that supports ML initiatives.